Google unemployment search data can provide a leading indicator of unemployment. Using internet-based search results in studies on labour markets has become increasingly popular over the last few years. Search data offer a substantial timing advantage over the survey-based unemployment indicators and also appear to correlate with ‘hard’ unemployment measures. Pan (2019) finds that internet-based unemployment indices in the US are positively associated with several labour market developments, including unemployment and layoff rates. Choi and Varian (2012) argue that simple seasonal auto-regressive models that include relevant Google Trends variables can outperform the standard models by 5% to 20%. Our data corroborate that online unemployment search patterns can serve as a leading indicator for EU labour markets when looking at the relative changes in unemployment rates and search behaviour in the early months of 2020.
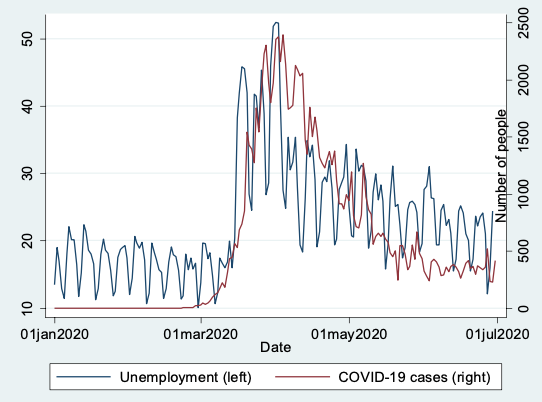
At the EU level, the Google search interest1 in the topic of unemployment spiked in March 2020, alongside the rising number of newly identified COVID-19 cases and the increasing severity of containment measures (Figure 1). Spikes in the unemployment search activity between January and March 2020 are associated with higher unemployment rates in the subsequent month. For the EU27 and the UK, this is particularly pronounced for some countries where search interest surged the most (e.g. Romania, Ireland, and Belgium). However, there is strong heterogeneity in the reactiveness of unemployment rates’ across the countries. This reflects different exposure to the COVID-19 shock, as well as labour market institutions and policy measures taken during the first months of the crisis. It also highlights the importance of controlling for such factors in the empirical assessment, which we address in the analysis.
Figure 1 Google search interest for the topic of unemployment and the number of identified C19 cases in the EU, weighted by the active population weights

Source: Authors’ calculations based on Google Trends and ECDC.
The impact of the COVID-19 shock varies across sectors and regions in the EU. Some economic activities and sectors have been particularly hard-hit, notably non-essential services requiring a high degree of face-to-face interaction or production relying heavily on inputs from global supply chains. Other sectors experienced little (if any) downturn in production. Such sectors include telecommunications, food, and healthcare, with companies showing little inclination to cut hours or jobs correspondingly (Fitch Ratings 2020, ifo Institute 2020). Moreover, some jobs are easier to perform remotely, provided that sufficient digital capacities are in place, reducing unemployment risks (Fadinger et al. 2020). Looking at sectoral exposure and company size, Doerr and Gambacorta (2020) find that regions in Southern Europe (and in France) have the highest shares of jobs under threat from the pandemic while risks are relatively low in Northern European regions. Similarly, a recent analysis by the OECD suggests that some regions in Greece, Spain, Portugal, and France are more exposed to unemployment risks. For example, tourism activities tend to be concentrated in those areas worst affected (OECD, 2020). Differences in sectoral exposure and economic activities are structural factors that are likely to impact individuals’ unemployment concerns and risks.
Companies’ financial strength before the crisis can reduce shock vulnerability. A corporation’s financial situation at the time of the COVID-19 shock is another key factor for supporting resilience (and reducing the fear of job losses). Companies’ cash reserves suffered heavily from unprecedented revenue drops during confinement. Having a larger financial buffer buys time. Moreover, it allows firms to respond more flexibly to the situation. ‘Easy-to-digitalise’ jobs could be moved to home offices but only if accompanied by the necessary digital expenditures. Hence, in regions with higher shares of corporate liquidity, employment should be more resilient, mitigating workers’ concerns.
We examine how the COVID-19 shock affected job market sentiment based on regional characteristics. We analyse a panel of 354 EU27 and UK regions2 in the period from 1 January 2020 to 29 June 2020. As a leading unemployment indicator, we use the search interest in the unemployment topic, as reported by Google Trends. The country-wide evolution of the COVID-19 pandemic comes from the European Centre for Disease Prevention and Control (ECDC). Our main identification strategy measures how the (constant) regional characteristics affected the propagation of the (time-varying) COVID-19 shock to the regional online search interest for the unemployment topic. For the regional metrics, we consider the share of employment in sectors exposed to COVID-19 (Doerr and Gambacorta 2020). The corporate health indicator is estimated as the firm-level cash buffer.3 Our analysis controls for the regional health capacity (number of hospital beds per inhabitant), income (households’ net disposable income), and population.4 Figure 2 present the cushioning effects of stronger liquidity buffers on unemployment concerns (for more detailed results, see EIB 2020).
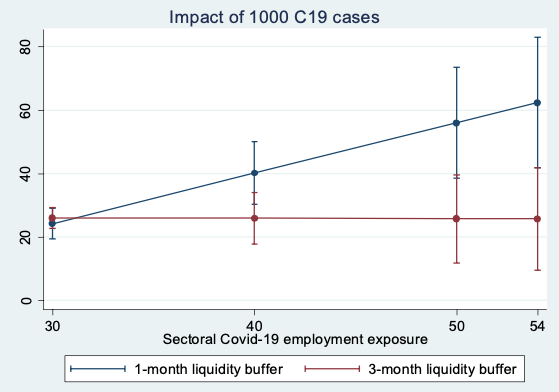
While the leading unemployment indicator was elevated in regions highly exposed to the coronavirus, a strong corporate ecosystem mitigated the impact. Controlling for a number of observable factors (as well as unobservable region-level and country-weekday and country-month fixed effects), we find that in regions with high COVID-19 employment risk, the COVID-19 shock resulted in higher online search intensity for the unemployment topic. However, this effect was less pronounced if companies in the region had stronger cash buffers. More specifically, an average region (where 50% of jobs are exposed to the COVID-19 shock in the magnitude of 1000 newly identified cases) could see the unemployment search intensity reach a level of 56 if the corporate liquidity buffers are only sufficient for one month of operations. However, two extra months of liquidity can cut the search intensity by more than a half, to the level of 26 (Figure 2). This suggests that where corporates are healthier and have stronger cash buffers, effects on employment are going to be less severe, with individuals less concerned about losing their jobs as a result.
Figure 2 Predicted values for the search intensity depending on the C19 employment exposure and corporate liquidity buffers

Notes: The graph shows the expected impact of 1000 newly identified cases, in an average EU region, on the search intensity scores for the topic of unemployment (vertical axis) depending on the COVID-19 exposure (vertical axis) and corporate liquidity buffers (blue vs red lines). With 1-month liquidity buffer, the expected search intensity score goes up with the COVID-19 exposure (blue line). This effect is however cushioned by stronger 3-month liquidity buffer (red line).
Source: Author’s calculations based on Google Trends, ECDC, Eurostat and ORBIS.
These results have implications for policymakers’ immediate crisis response (and beyond). The impact of firms’ liquidity on job market sentiment underscores the need to support companies’ access to finance as an immediate crisis response which should help to reduce uncertainty and limit negative repercussions on demand. The strong use of short-term work schemes across the EU (a distinctive feature of this crisis and supported by the EU Support to mitigate Unemployment Risks in an Emergency) has a double role in this respect, mitigating risks of job losses for workers and supporting corporate liquidity. Liquidity provision for firms (or other forms of providing access to credit) can also provide a cushion, preventing the transmission of the crisis to the labour market. However, such policy tools need to be deployed swiftly (Schivardi and Romano 2020).
These findings reemphasise the need for more structural policy measures to strengthen companies’ financial health and to boost resilience. Such policy measures include reducing operational obstacles for firms and incentivising investment in areas that boost profitability which enables firms to build up cash (Boone and Revoltella 2019). At the corporate level, technology adoption is key as digital firms in the EU tend to be more profitable, productive, and create more jobs (EIB 2019, Revoltella et al. 2020a). At the same time, the crisis has accelerated digitalisation overall. Policy measures that support companies’ transformation during the recovery, combined with investments in high-quality digital infrastructure, could help strengthen competitiveness and resilience. However, these efforts should be complemented with support for labour markets such as investments in skills and (re)training to adapt to changing demands.
References
Boone, L and D Revoltella (2019), “Policy change needed to accelerate investment in structural transformation”, VoxEU.org, 06 December.
Choi, H and H Varian (2012), “Predicting the Present with Google Trends”, Economic Record 88(s1): 2-9.
Doerr, S and L Gambacorta (2020), “Covid-19 and regional employment in Europe”, BIS Bulletin, May.
EIB (2019), EIB Investment Report 2019/2020: Accelerating Europe's transformation, Luxembourg: European Investment Bank.
EIB (2020), “COVID-19 economic update”, retrieved from EIB Economics Department, July.
Fadinger, H, J Schymik and J Valipour (2020), “My home is my castle - the benefits of working from home during a pandemic crisis: Evidence from Germany”, CEPR Discussion Paper 14871.
Fitch Ratings (2020), “Fitch Ratings Updates 2020 Sector Outlooks To Reflect Coronavirus Impact”, retrieved from Fitch Ratings, March.
ifo Institute (2020) “Short-time work reaches almost all sectors in Germany”, retrieved from ifo Institute, May.
OECD (2020), Employment Outlook 2020: Worker Security and the Covid-19 crisis, Paris: OECD.
Pan, W-F (2019), “Building sectoral job search indices for the United States”, Economics Letters 180: 89 - 93.
Revoltella, D, D Rückert and C Weiss (2020a), “Adoption of digital technologies by firms in Europe and the US: Evidence from the EIB Investment Survey”, VoxEU.org, 18 March.
Revoltella, D, L Maurin and R Pal (2020b), “EU firms in the post-Covid-19 environment: Investment-debt trade-offs and the optimal sequencing of policy responses”, VoxEU.org, 23 June.
Schivardi, F and G Romano (2020), “Liquidity Crisis: Keeping Firms afloat during COVID-19”, VoxEU.org, 28 July.
Endnotes
1 Our unemployment indicator is based on information from Google Trends, which offers a nearly a real-time sentiment indicator (with a 36 hour delay, for more information see https://trends.google.com). Information is available at the regional level allowing for fine-grained analyses of local labour market sentiment. It is based on representative samples of search queries focusing on the unemployment topic. The web-based unemployment indicator, in its original form, is measured as search interest over time in a specific region. The values are standardized to a scale between 0 and 100. A value of 100 is the peak popularity for the term in a given period. A value of 50 means that the term is half as popular as during the peak. A score of 0 means there was not enough data for this term.
2 While our baseline regional unit is the NUTS2 region, as defined by the Eurostat, some of the Google Trends results are available at different aggregation levels or for different regional units, like the UN ISO classification. We match these regions on the best effort basis, using a non-overlapping combination of different regional classifications in the analysis.
3 Doerr & Gambacorta (2020) estimate the share of employment in industries that are likely to be the most affected by the COVID-19 shock at the NUTS2 level (industry classifications G, H, I, R, S, T and U). Corporate health measures for how many months a company can sustain its outstanding obligations under the full lockdown scenario, as calibrated by Revoltella et al. (2020b). We calculate it at the firm level from ORBIS, for the same sectors as COVID-19 exposure index, and then aggregate it at the region level.
4 Source: Eurostat, most recent years available.
