

Women now make up 35% of workers in the United States’ 10 highest-paying occupations – up from 13% in 1980. They have increased their presence in almost all of these occupations, which include physicians, lawyers, and pharmacists.
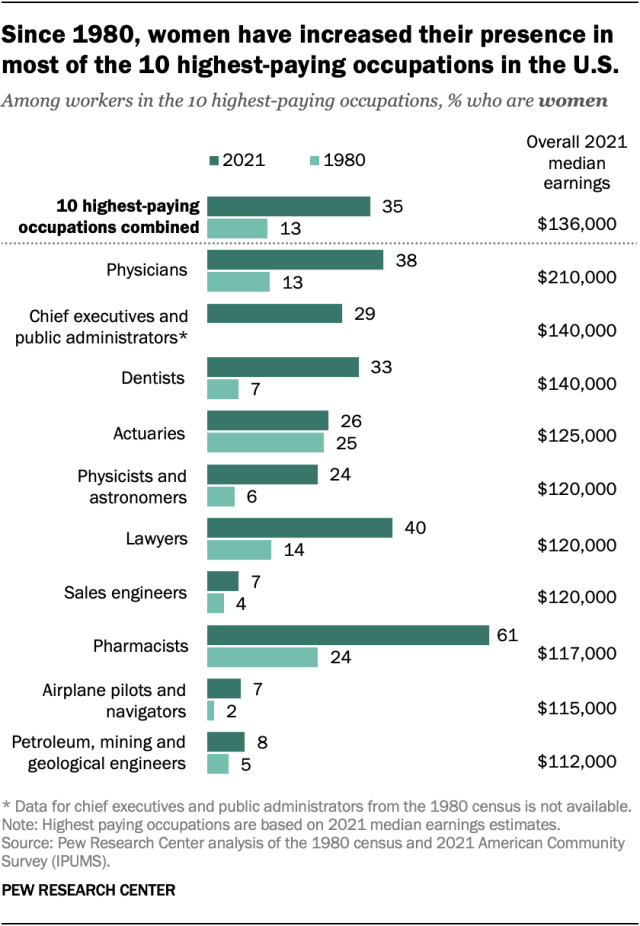
Still, women remain the minority in nine of the 10 highest-paying occupations. The exception is pharmacists, 61% of whom are women. More broadly, the share of women across all 10 of these occupations (35%) remains well below their share of the overall U.S. workforce (47%).
Workers in the 10 highest-paying occupations typically earn more than $100,000 a year, over twice the national average of $41,000.
Where women have made the most – and least – progress
Women’s presence has changed more noticeably in some of these occupations than in others. Since 1980, the share of women dentists has more than quadrupled (from 7% to 33%), while the share of women physicians has roughly tripled (from 13% to 38%). The share of lawyers who are women has risen from 14% to 40%.
The shares of women working in high-paying engineering fields have increased by smaller margins since 1980: Women make up less than 10% of sales engineers and petroleum, mining, and geological engineers.
Additionally, only 7% of airplane pilots and navigators are women, against 2% in 1980.
Women have gained ground in the completion of advanced degrees
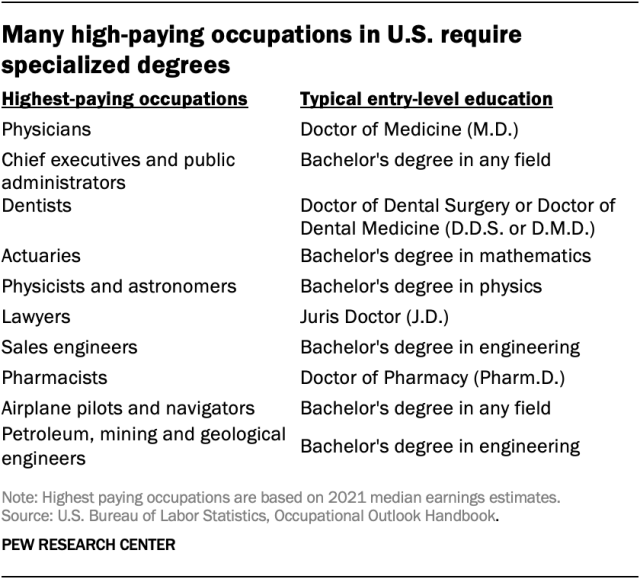
Some of these high-paying occupations – including physicians, lawyers, dentists, and pharmacists – require specialized graduate degrees. One way that women have increased their presence in high-paying occupations is by increasingly earning degrees that are required for these jobs.
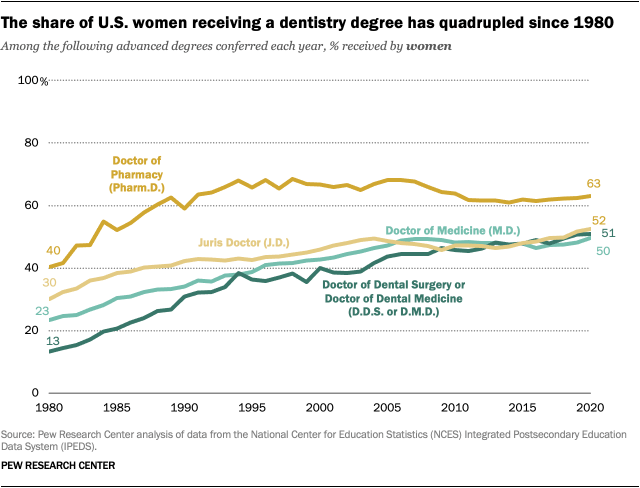
Women now make up about half of those receiving the following advanced degrees:
- Juris Doctor (J.D.): 52% of recipients today are women, versus 30% in 1980
- Doctor of Dental Surgery or Doctor of Dental Medicine (D.D.S. or D.M.D.): 51% of recipients are women, versus 13% in 1980
- Doctor of Medicine (M.D.): 50% of recipients are women, versus 23% in 1980
Women now also earn 63% of Doctor of Pharmacy (Pharm.D.) degrees – similar to their share of workers in the pharmacist occupation (61%). Pharmacists are also the only occupation in the top 10 where women make up the majority. This could be because the field offers flexible work hours, a collaborative environment, and family-friendly policies, according to economic research.
However, women remain in the minority among those receiving certain bachelor’s degrees required for some high-paying occupations:
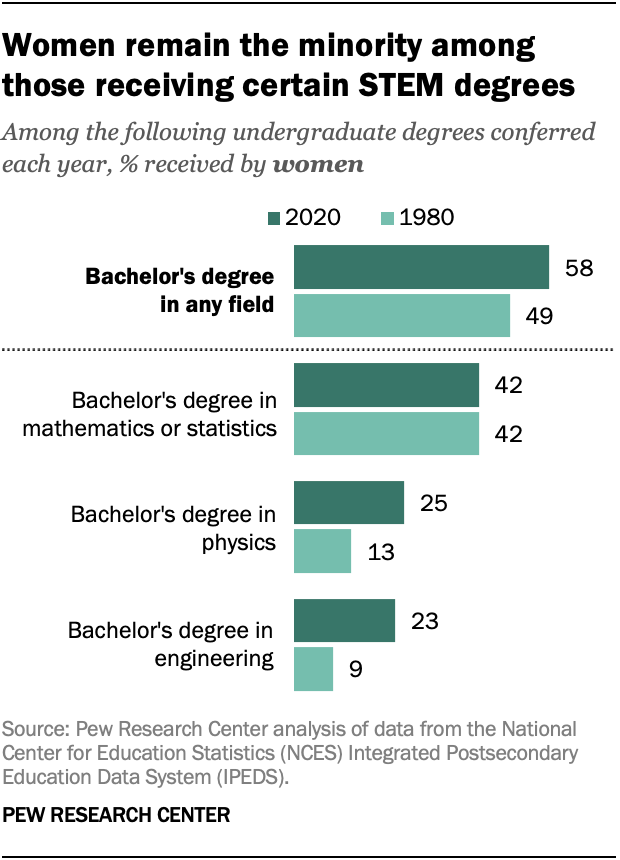
- Mathematics or statistics: 42% of recipients today are women, unchanged from 1980
- Physics: 25% of recipients are women, versus 13% in 1980
- Engineering: 23% of recipients are women, versus 9% in 1980
Outside of undergraduate major selection, there are other reasons women may experience barriers to entering high-paying occupations, even as they achieve parity in many advanced degree programs. Gender differences in household and parenting responsibilities may play a role, as could gender discrimination.