Jobs by JobLookup

Euro area unemployment at 6.3%


 In September 2024, the euro area seasonally-adjusted unemployment rate was 6.3%, stable compared with August 2024 and down from 6.6% in September 2023. The EU unemployment rate was 5.9% in September 2024, also stable compared with August 2024 and down from 6.1% in September 2023. These figures are published by Eurostat, the statistical office of the European Union.

Eurostat estimates that 13.042 million persons in the EU, of whom 10.884 million in the euro area, were unemployed in September 2024.

  • Compared with August 2024, unemployment increased by 61 thousand in the EU and by 13 thousand in the euro area.

  • Compared with September 2023, unemployment decreased by 226 thousand in the EU and by 330 thousand in the euro area.

Youth unemployment

In September 2024, 2.861 million young persons (under 25) were unemployed in the EU, of whom 2.287 million were in the euro area. In September 2024, the youth unemployment rate was 14.8% in the EU, up from 14.5% in August 2024, and 14.4% in the euro area, up from 14.3% in the previous month.

  • Compared with August 2024, youth unemployment increased by 44 thousand in the EU and by 10 thousand in the euro area.

  • Compared with September 2023, youth unemployment decreased by 16 thousand in the EU and by 68 thousand in the euro area.


Unemployment by sex

In September 2024, the unemployment rate for women was 6.1% in the EU, stable compared with the previous month, and the unemployment rate for men was 5.8%, up from 5.7% in August 2024. In the euro area, the unemployment rate for women was 6.5%, stable compared with the previous month, and the unemployment rate for men was 6.1%, also stable compared with August 2024.

Additional labour market indicators

The estimates in this News Release are based on the globally used International Labour Organisation (ILO) standard definition of unemployment, which counts as unemployed people without a job who have been actively seeking work in the last four weeks and are available to start work within the next two weeks.

To capture in full the labour market situation, the data on unemployment have been complemented by additional indicators, e.g. underemployed part-time workers, persons seeking work but not immediately available and persons available to work but not seeking, released together with LFS data for the second quarter of 2024.

LFS data for the third quarter of 2024 will be released on 13 December 2024.

Tables

Seasonally adjusted unemployment, totals

Rates (%)

Number of persons (in thousands)

2023

2024

2023

2024

Sep

Jun

Jul

Aug

Sep

Sep

Jun

Jul

Aug

Sep

Euro area

6.6

6.4

6.4

6.3

6.3

11 214

11 081

10 972

10 871

10 884

EU

6.1

6.0

6.0

5.9

5.9

13 268

13 169

13 094

12 981

13 042

Belgium

5.4

5.5

5.4

5.4

5.5

287

293

289

288

294

Bulgaria

4.4

4.0

4.0

4.0

4.0

135

122

123

123

122

Czechia

2.6

2.7

2.7

2.7

2.8

136

139

139

140

145

Denmark

4.7

6.2

5.9

5.9

6.4

149

202

193

193

211

Germany

3.1

3.5

3.5

3.5

3.5

1 361

1 555

1 560

1 556

1 547

Estonia

6.7

7.4

7.8

7.6

7.6

49

56

59

58

58

Ireland

4.5

4.5

4.7

4.4

4.3

127

128

136

125

124

Greece

10.7

9.4

9.8

9.5

9.3

504

443

457

445

438

Spain

12.0

11.5

11.4

11.3

11.2

2 910

2 816

2 797

2 762

2 744

France

7.4

7.5

7.5

7.5

7.6

2 276

2 349

2 346

2 350

2 379

Croatia

6.0

5.0

5.0

4.9

4.8

104

88

87

86

84

Italy

7.7

6.8

6.3

6.1

6.1

1 975

1 731

1 612

1 567

1 552

Cyprus

5.6

5.1

5.3

5.3

5.0

28

26

27

27

26

Latvia

6.6

6.9

6.9

7.0

6.9

63

65

65

66

65

Lithuania

7.2

7.2

8.0

7.9

7.9

111

115

124

127

123

Luxembourg

5.5

5.8

5.8

5.9

5.9

19

20

20

20

20

Hungary

4.1

4.3

4.4

4.4

4.5

203

212

215

217

220

Malta

3.6

3.0

2.9

3.0

3.0

11

10

9

10

10

Netherlands

3.7

3.6

3.6

3.7

3.7

371

370

370

374

377

Austria

5.3

5.2

5.1

5.3

5.6

251

248

239

252

267

Poland

2.9

2.9

2.9

2.9

2.9

510

509

507

511

513

Portugal

6.6

6.5

6.5

6.4

6.4

356

349

349

346

352

Romania

5.6

5.1

5.4

5.5

5.5

455

431

451

452

451

Slovenia

3.7

3.5

3.4

3.3

3.4

38

36

34

34

35

Slovakia

5.8

5.3

5.3

5.3

5.2

159

147

147

146

145

Finland

7.4

8.4

8.4

8.4

8.4

211

239

239

239

238

Sweden

7.9

8.4

8.4

8.5

8.5

450

481

483

485

487

Iceland

3.6

3.1

3.1

:

:

8

8

7

:

:

Norway

3.6

4.0

4.0

4.0

4.0

108

120

120

120

120

Switzerland

4.2

4.2

:

:

:

212

215

:

:

:

United States

3.8

4.1

4.3

4.2

4.1

6 279

6 807

7 104

7 070

6 785

Seasonally adjusted youth (under 25s) unemployment

Rates (%)

Number of persons (in thousands)

2023

2024

2023

2024

Sep

Jun

Jul

Aug

Sep

Sept

Jun

Jul

Aug

Sep

Euro area

14.8

14.5

14.4

14.3

14.4

2 355

2 306

2 294

2 277

2 287

EU

14.8

14.7

14.7

14.5

14.8

2 877

2 853

2 853

2 817

2 861

Belgium

17.5

16.7

16.5

16.5

16.5

75

70

63

63

63

Bulgaria

13.6

11.8

11.9

11.4

11.1

16

14

14

13

13

Czechia

8.1

10.6

11.1

11.1

12.7

22

30

35

33

35

Denmark

12.2

14.8

13.6

15.1

15.3

56

76

67

75

79

Germany

5.8

6.9

6.9

6.9

6.9

261

319

319

318

316

Estonia

19.9

23.0

21.8

20.4

20.8

12

14

14

12

13

Ireland

11.6

10.2

11.6

10.7

10.8

42

37

42

39

40

Greece

23.1

22.1

19.7

19.4

16.3

63

54

48

50

36

Spain

28.4

26.5

26.7

26.5

26.5

494

477

487

485

488

France

17.7

17.7

17.4

17.3

17.7

599

599

589

587

604

Croatia

18.6

16.7

16.3

16.3

16.3

23

21

20

20

20

Italy

22.9

20.5

19.8

18.1

18.3

347

298

290

262

266

Cyprus

16.8

15.4

15.9

15.9

15.9

6

5

5

5

5

Latvia

13.4

17.3

16.3

16.4

16.6

9

11

10

10

10

Lithuania

15.6

21.4

19.0

20.5

19.8

15

23

20

22

21

Luxembourg

19.8

20.3

20.3

20.3

20.3

5

5

5

5

5

Hungary

13.0

14.6

15.7

16.2

17.2

40

46

49

51

54

Malta

8.7

8.7

8.6

9.0

9.4

3

2

2

2

3

Netherlands

8.8

8.6

8.6

8.9

9.0

160

157

156

159

161

Austria

11.4

9.6

9.9

13.2

10.0

61

50

51

70

53

Poland

11.0

10.1

10.1

10.2

10.1

124

110

109

110

108

Portugal

22.0

21.0

20.8

20.1

21.6

84

76

75

74

81

Romania

21.3

23.2

:

:

:

102

114

:

:

:

Slovenia

11.5

10.1

11.5

11.5

11.5

8

7

7

7

7

Slovakia

20.6

21.1

21.1

21.0

21.4

29

30

30

30

30

Finland

17.0

18.0

18.1

18.2

18.4

55

59

59

59

60

Sweden

22.2

24.4

24.4

24.6

24.7

151

167

167

168

169

Iceland

8.6

8.6

8.6

:

:

3

3

3

:

:

Norway

10.4

12.0

11.6

11.3

12.4

45

54

50

49

53

Switzerland

8.6

6.8

:

:

:

51

41

:

:

:

Seasonally adjusted unemployment rates (%), by sex

Males

Females

2023

2024

2023

2024

Sep

Jun

Jul

Aug

Sep

Sep

Jun

Jul

Aug

Sep

Euro area

6.2

6.2

6.2

6.1

6.1

6.9

6.7

6.6

6.5

6.5

EU

5.8

5.8

5.8

5.7

5.8

6.4

6.2

6.1

6.1

6.1

Belgium

5.7

5.8

5.8

5.8

5.9

5.1

5.1

5.0

4.9

5.1

Bulgaria

4.6

4.2

4.3

4.3

4.4

4.3

3.8

3.8

3.7

3.6

Czechia

2.3

2.4

2.4

2.2

2.4

3.1

3.1

3.1

3.3

3.3

Denmark

4.5

5.6

5.2

5.5

5.9

4.9

6.9

6.6

6.3

7.1

Germany

3.3

3.8

3.8

3.8

3.8

2.8

3.2

3.2

3.2

3.1

Estonia

6.2

7.4

7.8

7.5

7.5

7.1

7.4

7.7

7.7

7.7

Ireland

4.6

4.5

4.7

4.4

4.3

4.5

4.4

4.7

4.4

4.3

Greece

8.6

7.6

7.8

7.7

7.6

13.4

11.6

12.2

11.7

11.4

Spain

10.5

10.3

10.3

10.2

10.2

13.7

12.9

12.7

12.5

12.4

France

7.5

7.5

7.4

7.5

7.5

7.3

7.6

7.5

7.6

7.7

Croatia

5.5

4.8

4.8

4.7

4.7

6.6

5.3

5.2

5.1

5.0

Italy

6.8

6.1

6.1

5.8

5.7

8.9

7.6

6.6

6.6

6.6

Cyprus

5.8

4.5

4.6

4.5

4.5

5.4

5.7

6.0

6.1

5.6

Latvia

7.7

8.0

8.3

8.6

8.5

5.5

5.7

5.4

5.3

5.1

Lithuania

7.8

8.3

8.4

8.3

8.3

6.6

6.0

7.6

7.5

7.5

Luxembourg

5.3

5.9

5.9

5.9

5.9

5.8

5.7

5.7

5.8

5.8

Hungary

4.1

4.4

4.4

4.5

4.5

4.1

4.3

4.3

4.3

4.4

Malta

3.8

3.4

3.2

3.2

3.3

3.3

2.6

2.5

2.7

2.6

Netherlands

3.6

3.5

3.5

3.5

3.5

3.8

3.8

3.8

3.9

3.9

Austria

5.7

5.7

5.8

6.0

6.1

4.9

4.7

4.3

4.6

5.1

Poland

2.8

2.9

2.9

2.9

2.8

2.9

2.8

2.8

2.9

3.0

Portugal

6.3

6.2

6.3

6.1

6.2

6.9

6.7

6.7

6.6

6.7

Romania

6.0

5.5

5.7

5.8

5.7

5.1

4.6

5.1

5.1

5.2

Slovenia

3.5

3.5

3.3

3.3

3.5

4.0

3.5

3.4

3.3

3.4

Slovakia

5.6

4.8

4.7

4.7

4.7

5.9

5.9

6.0

6.0

5.9

Finland

8.1

9.5

9.5

9.4

9.3

6.7

7.2

7.3

7.4

7.4

Sweden

7.7

8.4

8.4

8.3

8.3

8.1

8.5

8.5

8.6

8.7

Iceland

4.0

3.6

3.5

:

:

3.1

2.6

2.6

:

:

Norway

3.6

4.3

4.1

4.3

4.4

3.3

3.8

3.6

3.7

3.7

Switzerland

4.0

4.0

:

:

:

4.4

4.5

:

:

:

Euro area annual inflation is expected to be 2.0% in October 2024, up from 1.7% in September according to a flash estimate from Eurostat, the statistical office of the European Union.

Looking at the main components of euro area inflation, services is expected to have the highest annual rate in October (3.9%, stable compared with September), followed by food, alcohol & tobacco (2.9%, compared with 2.4% in September), non-energy industrial goods (0.5%, compared with 0.4% in September) and energy (-4.6%, compared with -6.1% in September).

Tables

Euro area annual inflation and its components (%)

Weights (‰)

Annual rate

Monthly rate

2024

Oct 23

May 24

Jun 24

Jul 24

Aug 24

Sep 24

Oct 24

Oct 24

All-items HICP

1000.0

2.9

2.6

2.5

2.6

2.2

1.7

2.0e

0.3e

All-items excluding:

energy

900.9

4.9

2.8

2.8

2.7

2.7

2.6

2.7e

0.3e

energy, unprocessed food

857.4

5.0

2.9

2.8

2.8

2.8

2.7

2.7e

0.2e

energy, food, alcohol & tobacco

706.2

4.2

2.9

2.9

2.9

2.8

2.7

2.7e

0.2e

Food, alcohol & tobacco

194.7

7.4

2.6

2.4

2.3

2.3

2.4

2.9e

0.7e

processed food, alcohol & tobacco

151.2

8.4

2.8

2.7

2.7

2.7

2.6

2.9e

0.3e

unprocessed food

43.5

4.5

1.8

1.3

1.0

1.1

1.6

3.0e

2.1e

Energy

99.1

-11.2

0.3

0.2

1.2

-3.0

-6.1

-4.6e

0.4e

Non-energy industrial goods

257.3

3.5

0.7

0.7

0.7

0.4

0.4

0.5e

0.7e

Services

448.8

4.6

4.1

4.1

4.0

4.1

3.9

3.9e

0.0e

Inflation rates (%) measured by the HICP


Annual rate

Monthly rate

Oct 23

May 24

Jun 24

Jul 24

Aug 24

Sep 24

Oct 24

Oct 24

Belgium

-1.7

4.9

5.4

5.4

4.3

4.3

4.7e

0.7e

Germany

3.0

2.8

2.5

2.6

2.0

1.8

2.4e

0.4e

Estonia

5.0

3.1

2.8

3.5

3.4

3.2

4.5e

0.8e

Ireland

3.6

2.0

1.5

1.5

1.1

0.0

0.1e

0.3e

Greece

3.8

2.4

2.5

3.0

3.2

3.1

3.2e

0.2e

Spain

3.5

3.8

3.6

2.9

2.4

1.7

1.8e

0.4e

France

4.5

2.6

2.5

2.7

2.2

1.4

1.5e

0.3e

Croatia

6.7

4.3

3.5

3.3

3.0

3.1

3.5e

0.8e

Italy

1.8

0.8

0.9

1.6

1.2

0.7

1.0e

0.3e

Cyprus

3.6

3.0

3.0

2.4

2.2

1.6

1.6e

-0.2e

Latvia

2.3

0.0

1.5

0.8

0.9

1.6

2.1e

0.1e

Lithuania

3.1

0.9

1.0

1.1

0.8

0.4

0.1e

0.1e

Luxembourg

2.1

3.2

2.8

2.7

1.7

0.8

0.9e

-0.1e

Malta

4.2

2.3

2.2

2.3

2.4

2.1

2.3e

-1.1e

Netherlands

-1.0

2.7

3.4

3.5

3.3

3.3

3.3e

0.6e

Austria

4.9

3.3

3.1

2.9

2.4

1.8

1.8e

0.4e

Portugal

3.2

3.8

3.1

2.7

1.8

2.6

2.6e

-0.4e

Slovenia

6.6

2.5

1.6

1.4

1.1

0.7

0.0e

-0.3e

Slovakia

7.8

2.6

2.4

3.0

3.2

2.9

3.5e

0.7e

Finland

2.4

0.4

0.5

0.5

1.1

1.0

1.5e

0.8e

Notes for users

Revisions and timetable

The euro area inflation flash estimate is issued at the end of each reference month.

The complete set of harmonized indices of consumer prices (HICP) for the euro area, EU, and Member States is released around the middle of the month following the reference month.

The next release with full data for October 2024 is scheduled for 19 November 2024.

Methods and definitions

Annual inflation is the change in the price level of consumer goods and services between the current month and the same month of the previous year. Monthly inflation is the change in the price level between the current month and the previous month.

Geographical information

The euro area consists of Belgium, Germany, Estonia, Ireland, Greece, Spain, France, Croatia, Italy, Cyprus, Latvia, Lithuania, Luxembourg, Malta, the Netherlands, Austria, Portugal, Slovenia, Slovakia and Finland.

The euro area data refers to the country composition at a specific point in time. Changes in the composition of the euro area are incorporated using a chain index formula.

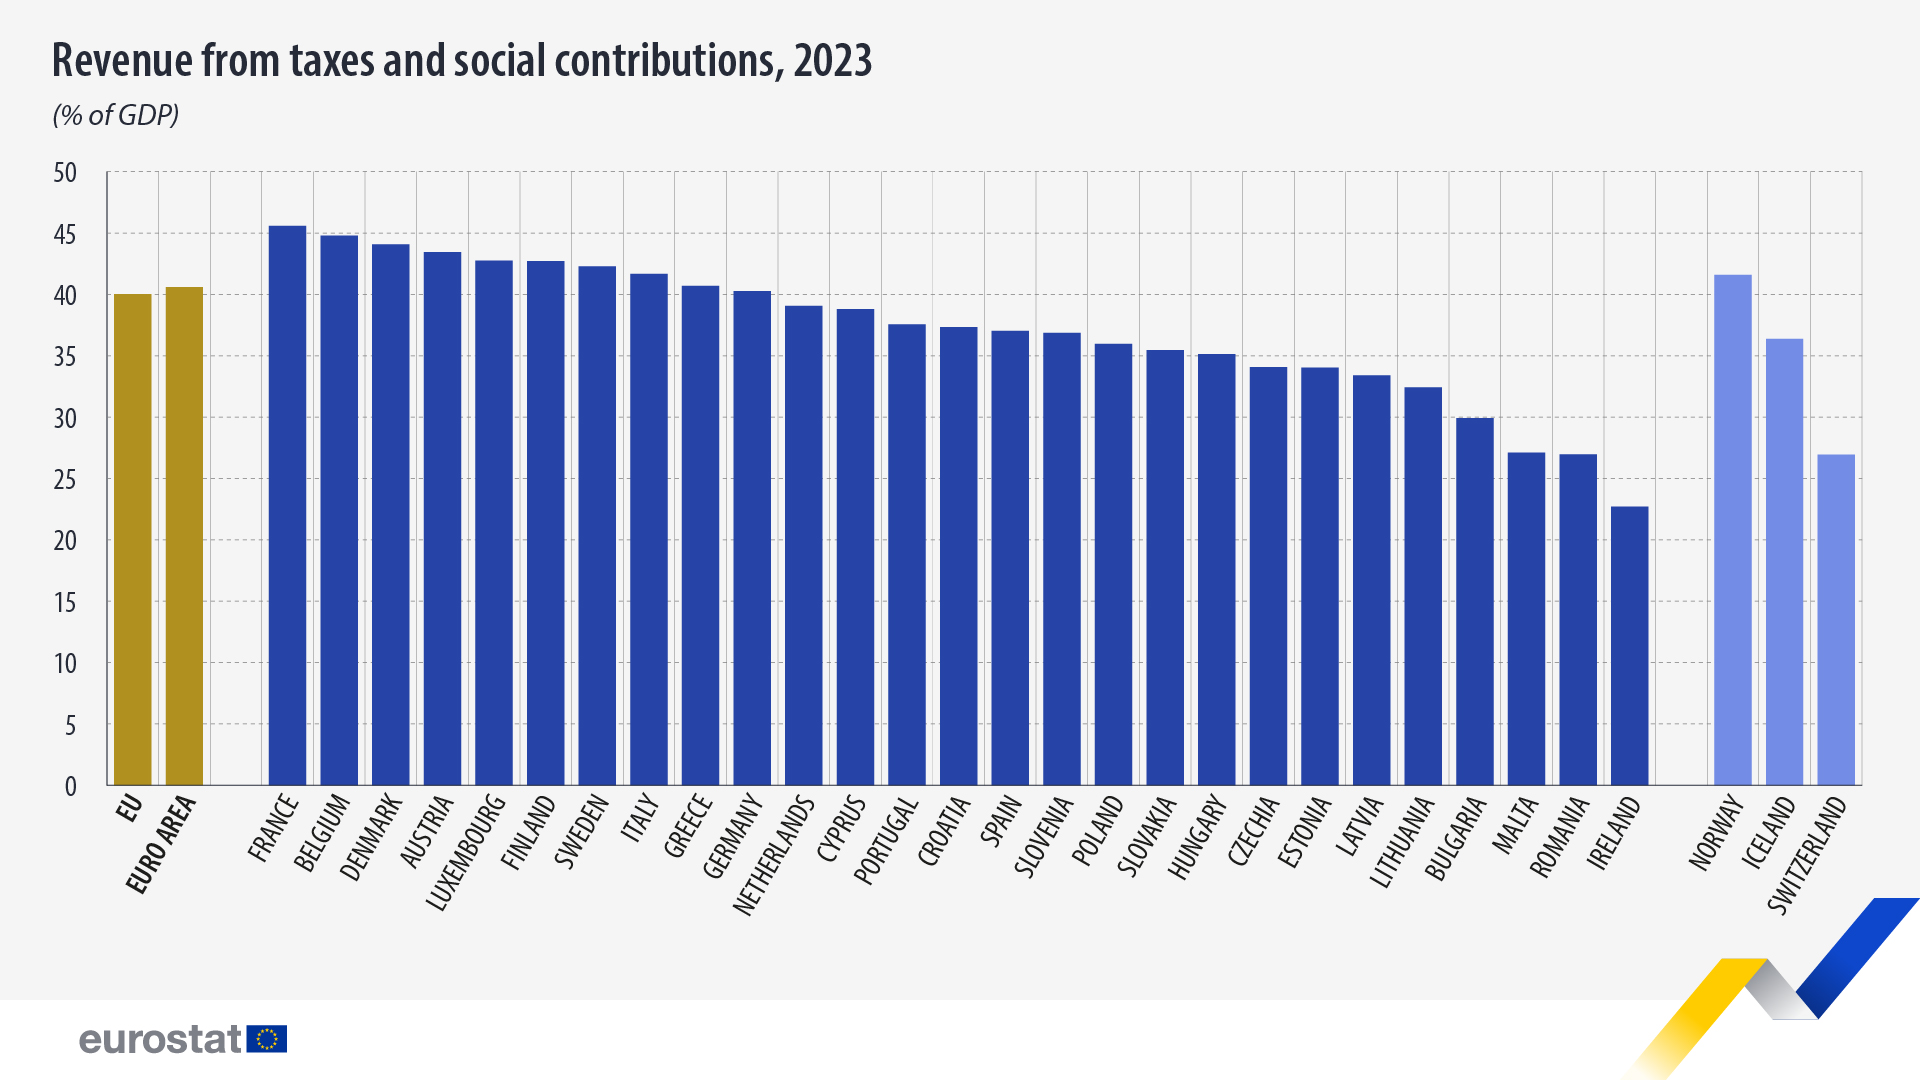
The overall tax-to-GDP ratio, meaning the sum of taxes and net social contributions as a percentage of gross domestic product (GDP), stood at 40.0% in the EU in 2023, a decrease compared with 2022 (40.7%). In the euro area, the tax-to-GDP ratio also decreased from 41.4% in 2022 to 40.6% in 2023.

In absolute terms, in 2023, revenue from taxes and social contributions increased by €308 billion in the EU compared with 2022, to stand at €6 883 billion.

This information comes from data on taxation published by Eurostat today. This article presents some findings from the more detailed Statistics Explained article.

Highest tax-to-GDP ratio in France, Belgium and Denmark

The tax-to-GDP ratio varied significantly between EU countries in 2023, with the highest shares of taxes and social contributions as a percentage of GDP being recorded in France (45.6%), Belgium (44.8%) and Denmark (44.1%).

At the opposite end of the scale, Ireland (22.7%), Romania (27.0%) and Malta (27.1%) registered the lowest ratios. 

Revenue from taxes and social contributions, 2023 (% of GDP). Bar chart. See full dataset below.

Source dataset: gov_10a_taxag

Largest increases of tax-to-GDP ratios in Cyprus and Luxembourg

In 2023, compared with 2022, the tax-to-GDP ratio increased in 11 EU countries, with the largest increases being observed in Cyprus (from 35.9% in 2022 to 38.8% in 2023) and Luxembourg (40.2% in 2022 and 42.8% in 2023).

In contrast, decreases of more than 0.1 percentage points of GDP were recorded in 12 EU countries, with the largest decreases noted in Greece (from 42.8% in 2022 to 40.7% in 2023) and France (from 47.6% in 2022 to 45.6% in 2023).

Changes in tax-to-gdp ratio, 2023 compared with 2022 (in percentage points). Bar chart. See link to full dataset below.

Source dataset: gov_10a_taxag


Post a Comment

Previous Post Next Post