Inflation in the United States is down significantly from its recent highs, falling from an annual rate of 9.1% in June 2022 to 2.5% in August 2024. But actual prices remain elevated and, absent a recession, are likely to stay that way.
On average, consumer prices in August 2024 were 22.0% above where they were in January 2020, before the COVID-19 pandemic scrambled the U.S. economy and much of the rest of American life. Today, 74% of Americans say they are very concerned about the price of food and consumer goods, while 69% say the same about housing costs, according to a recent Pew Research Center survey.
Of course, people don’t live on national averages. They live in particular places and buy particular things, and their experiences of inflation depend greatly on those particulars. The cost of apartments in Atlanta, bananas in Boston and sportswear in Seattle all factor into the national average inflation rate but can – and do – vary considerably from it:
Inflation and prices – not the same thing
“Inflation” often is confused with the actual prices people pay for goods and services. The inflation rate refers to how much prices have risen over the past month, the past year, or some other period. A lower inflation rate means consumer prices are rising more slowly than they had been, not that they’re falling in absolute terms.
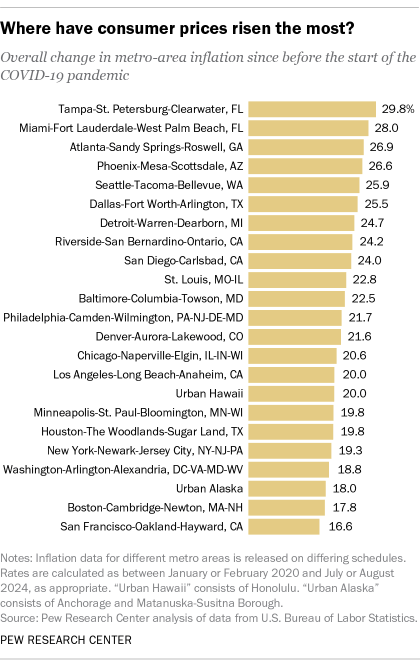
- Since early 2020, for example, consumer prices are up nearly 30% in the Tampa-St. Petersburg-Clearwater metro area, 24.0% in San Diego-Carlsbad, and “only” 16.6% in the San Francisco-Oakland-Hayward metro area (though prices started out considerably higher in the Bay Area than in the other metro areas studied).
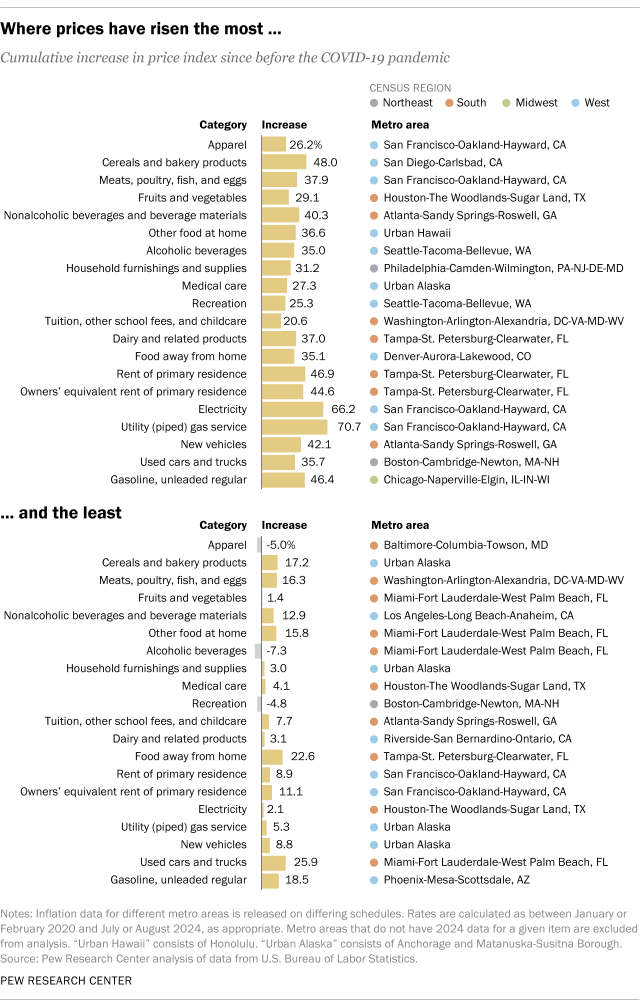
- Of the metros we analyzed, the Bay Area has seen the largest increase in electricity prices (up by nearly two-thirds since the pre-pandemic days of early 2020) but the smallest increase in rent of primary residences (8.9%, though again starting from a relatively high base).
- Looking to drown your budgeting sorrows? Alcoholic beverages are 35.0% more expensive in the Seattle-Tacoma-Bellevue metro area today than in February 2020, but 7.3% less expensive in Miami-Fort Lauderdale-West Palm Beach.
To get a sense of where prices for various products and services have risen the most and least, we dug into the U.S. Bureau of Labor Statistics consumer inflation data for 23 metropolitan areas, which together account for more than a third of the U.S. population. In each area, we tracked the prices of 20 items in the Consumer Price Index for All Urban Consumers (CPI-U).
From early 2020 to summer 2024, consumer prices rose faster than the national average rate in 11 of the 23 metro areas we examined, led by three in the Southeast: Tampa-St. Petersburg-Clearwater, Miami-Fort Lauderdale-West Palm Beach, and Atlanta-Sandy Springs-Roswell.
Higher housing costs are a big reason why Tampa-St. Petersburg-Clearwater leads the table. Housing costs – represented in our analysis by “rent of primary residence” and “owners’ equivalent rent of primary residence” (OER) – account for about a third of the overall CPI-U, so even small movements in those items can have an outsized effect on overall inflation readings. And since the start of 2020, both rent and OER have risen more in Tampa-St. Petersburg-Clearwater (46.9% and 44.6%, respectively) than any other metro area we examined.
As with electricity, some items in the CPI-U show quite a lot of disparity between metro areas. Natural gas, for instance, costs nearly 71% more in the Bay Area than it did at the start of 2020, but just 5.3% more in Urban Alaska (which covers Anchorage and Matanuska-Susitna Borough). Recreation costs are 25.3% higher in the Seattle metro area, but nearly 5% lower in the Boston metro area.
Prices for other items have risen more consistently across metros. Used cars and trucks, for instance, are at least 30.0% more expensive in 16 of the 23 metro areas we looked at. Inflation in that category since early 2020 ranges from nearly 36% in the Boston metro area to about 26% in metro Miami.
And eating out – as captured in a CPI-U item called “food away from home” – is anywhere from 35.1% more expensive in metro Denver to 22.6% more expensive in Tampa-St. Petersburg-Clearwater, compared with January 2020 prices.